01 · DETECT
Localized surface findings
Rail-surface candidates are delineated and retained as reviewable visual evidence rather than reduced to a class label alone.
A quantitative evidence layer for engineering review: localized rail-surface findings, mask-based geometry, rail-head position, review prioritisation, section-level condition evidence and archive-ready inspection records.
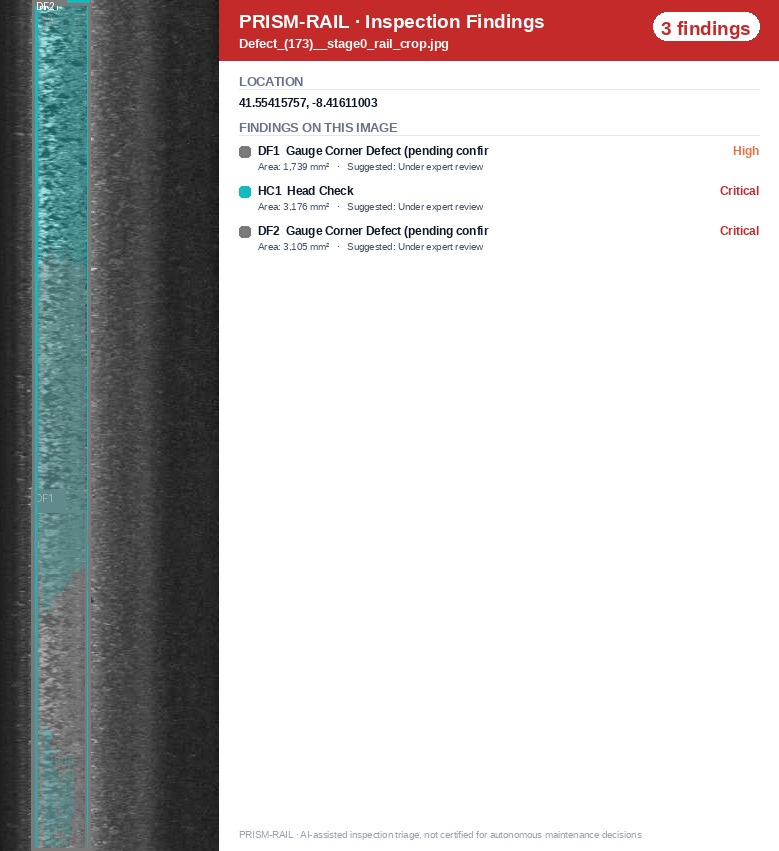
The differentiating layer begins after a visual anomaly is found: where it lies on the rail head, how its visible extent is quantified, how the evidence is documented, and how cases are prioritised for engineering review.
Rail-surface candidates are delineated and retained as reviewable visual evidence rather than reduced to a class label alone.
Length, width and area are estimated in engineering units when image calibration is available, enabling comparable defect-level records.
Running band, gauge shoulder and gauge-corner context are carried into the record to distinguish defects that look similar but occur in different locations.
Evidence is ranked so inspectors can see which images and instances deserve attention first. It is a review aid—not an autonomous safety decision.
Defect evidence can be aggregated into section-level condition views and standards-aware indices, with operator-specific calibration during a pilot.
Mask source, image, geometry, zone, evidence cues and review state are retained so outputs can be audited rather than treated as black-box scores.
The same rail crop is carried from source image to rail-head context and finally to measured findings. Every displayed image below is stored locally inside this website package.
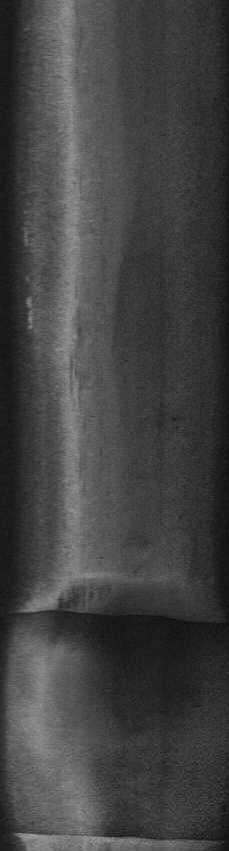
The starting inspection crop is preserved as source evidence.
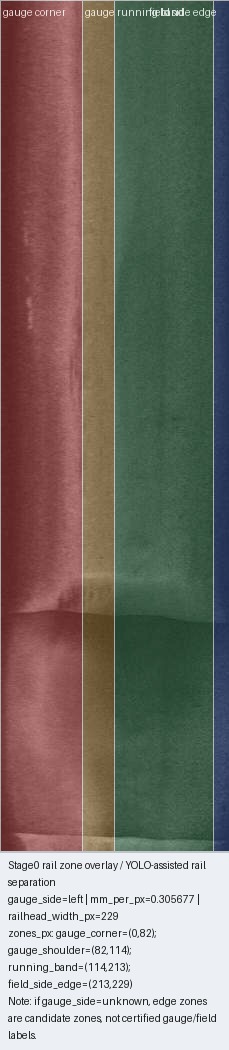
Running-band and gauge-side context are added before the finding is interpreted.
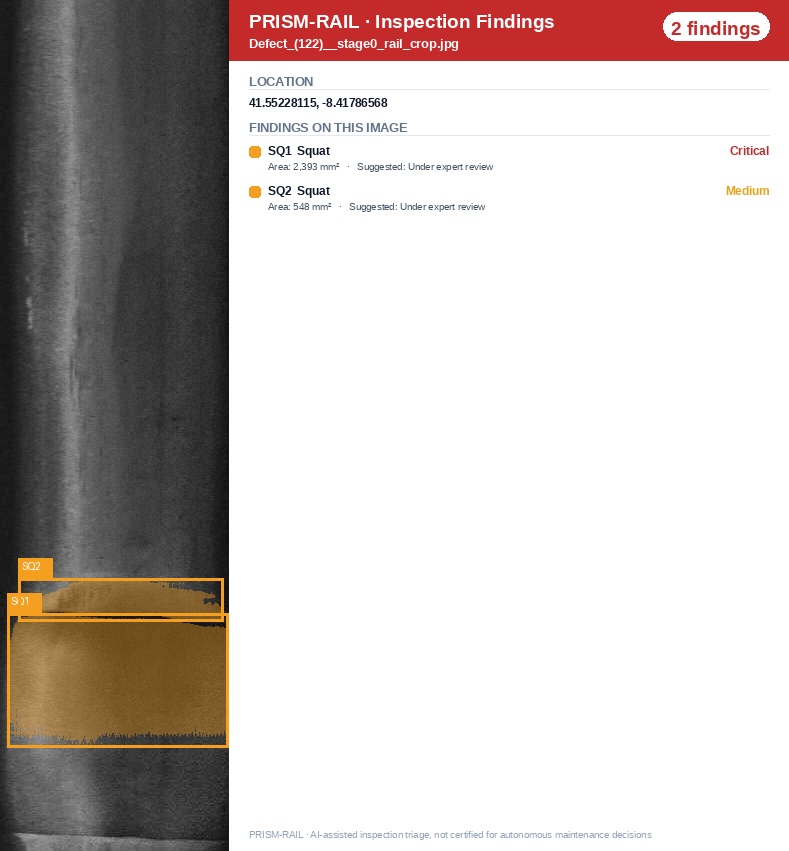
Finding class, geometry, priority and review information become an auditable case record.
These cases were selected to show distinct operational situations—not only the most visually dramatic defects. Click any card to inspect the full-resolution image.
Three localized findings, two requiring review; illustrates gauge-side engineering context.
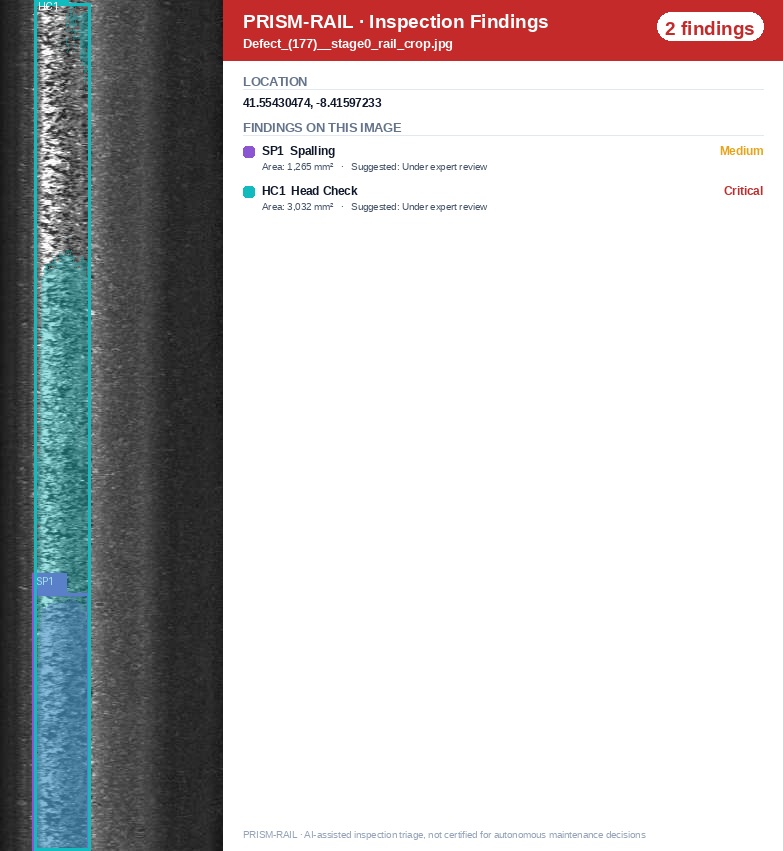
Two finding types on the same image, demonstrating multi-defect evidence rather than one-label classification.
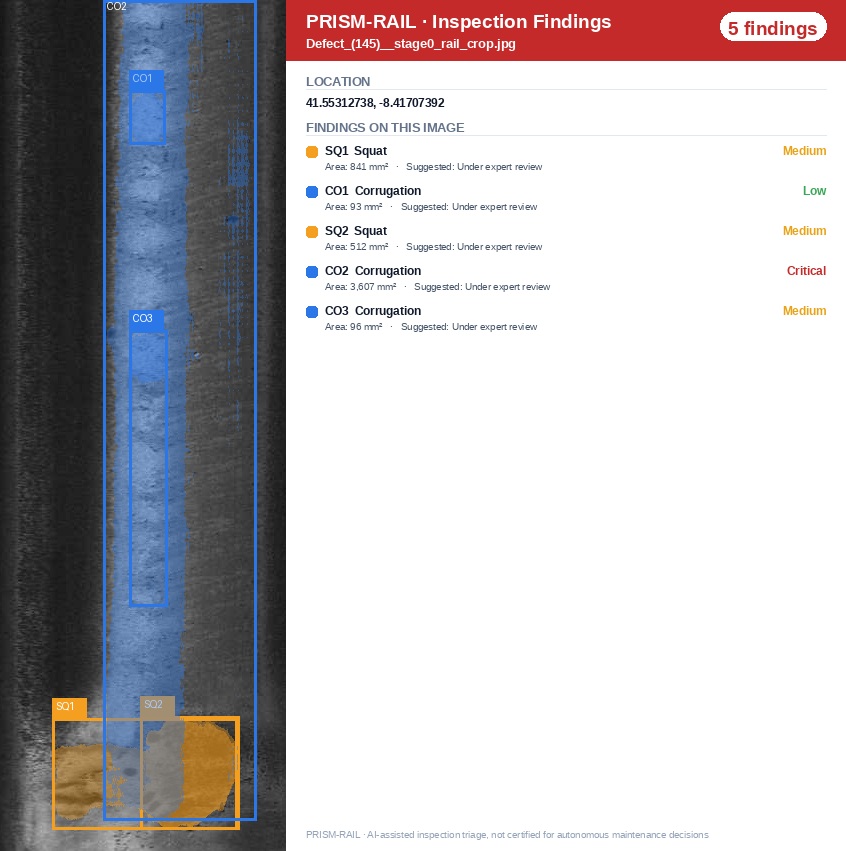
Five localized findings in the running band; useful for demonstrating defect burden and review prioritisation.
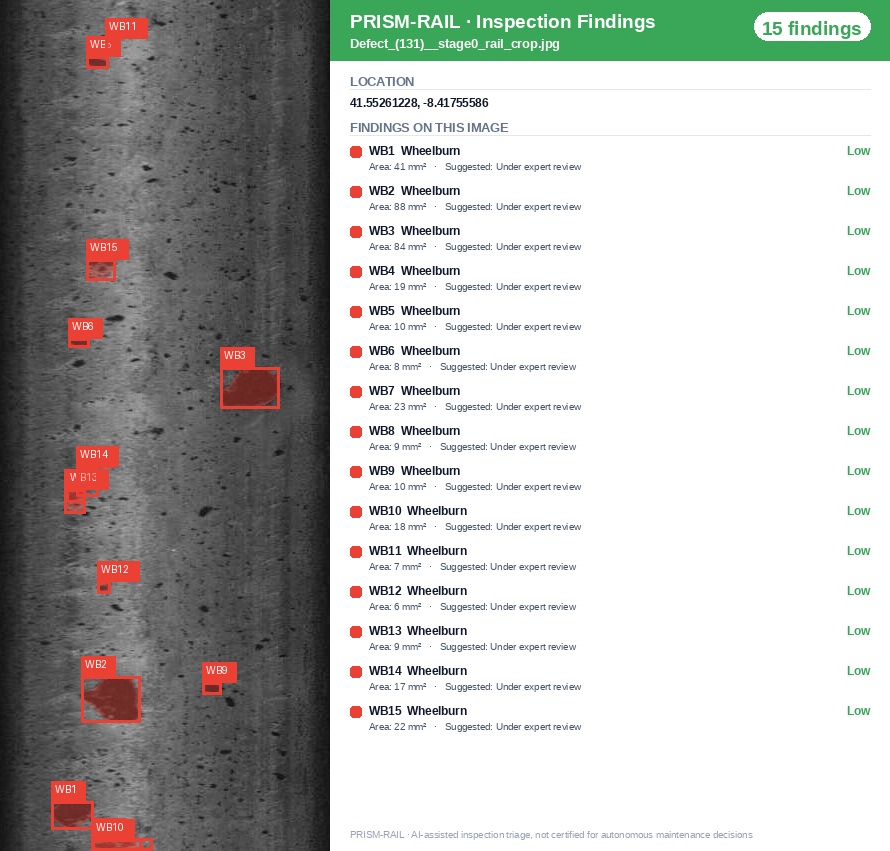
Fifteen small findings demonstrate why count alone should not be confused with severity or maintenance priority.
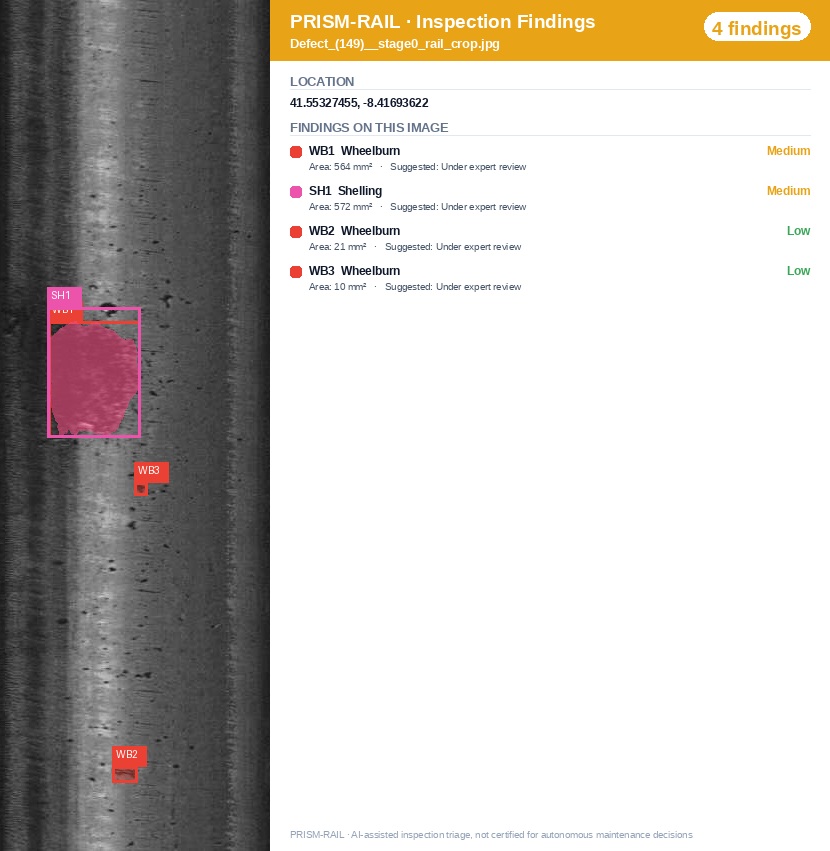
Shows how class and rail-head location can coexist in the same review record.
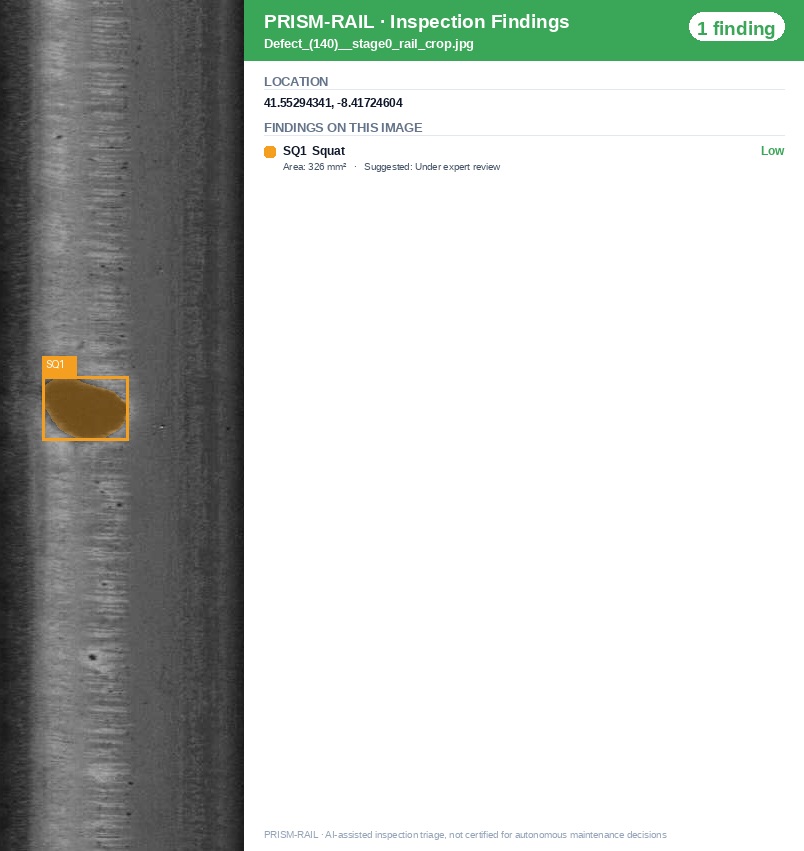
A simple inspector-facing card view with the localized defect, image location and review suggestion.
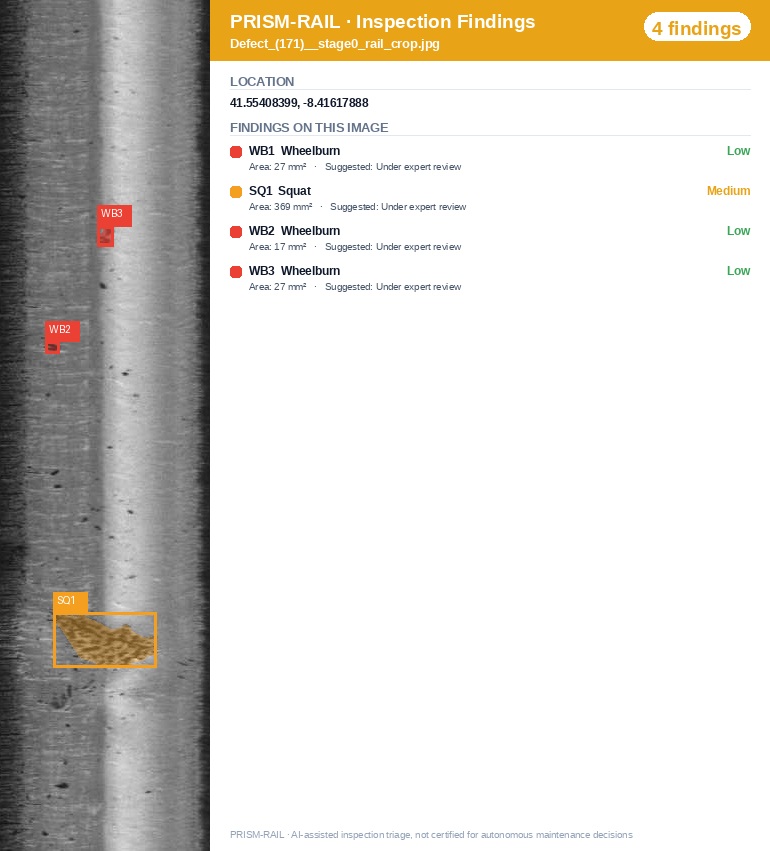
A denser example showing multiple findings on one image, useful for triage workload and review-board design.
The locked run contains both instance-level evidence and aggregated triage views. The following summary uses only this single run so numbers are not mixed across experiments.
198 post-check findings. The labels below represent prototype triage priority, not certified safety risk.
The locked report intentionally carries both numbers and warns against quoting either one without its population definition.
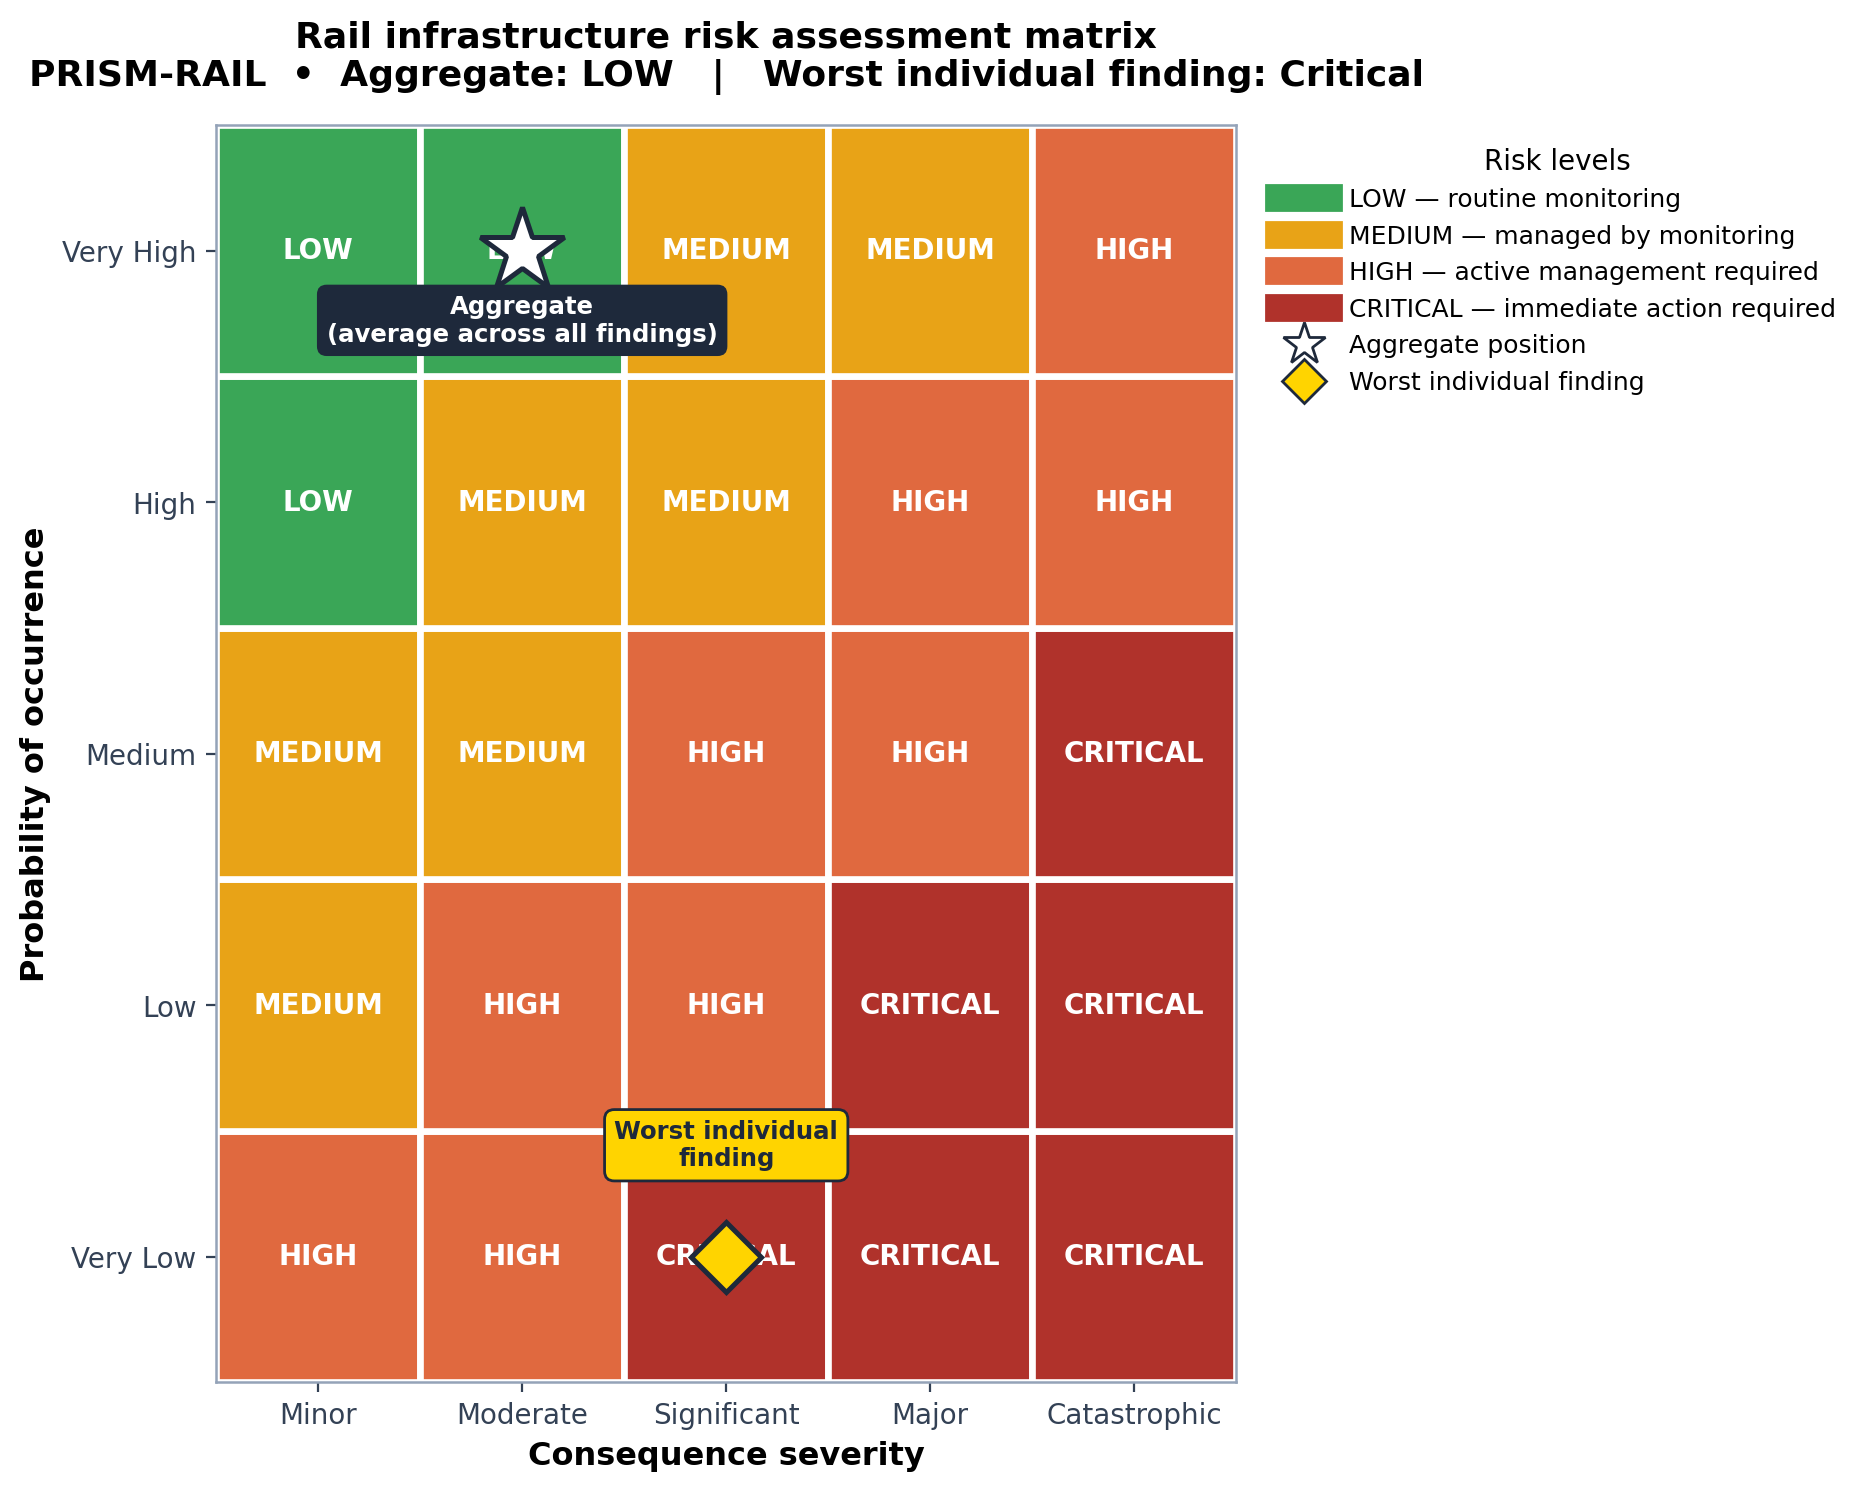
Existing engineering risk logic can be used as a review scaffold, but thresholds and consequence classes must be calibrated with the operator.
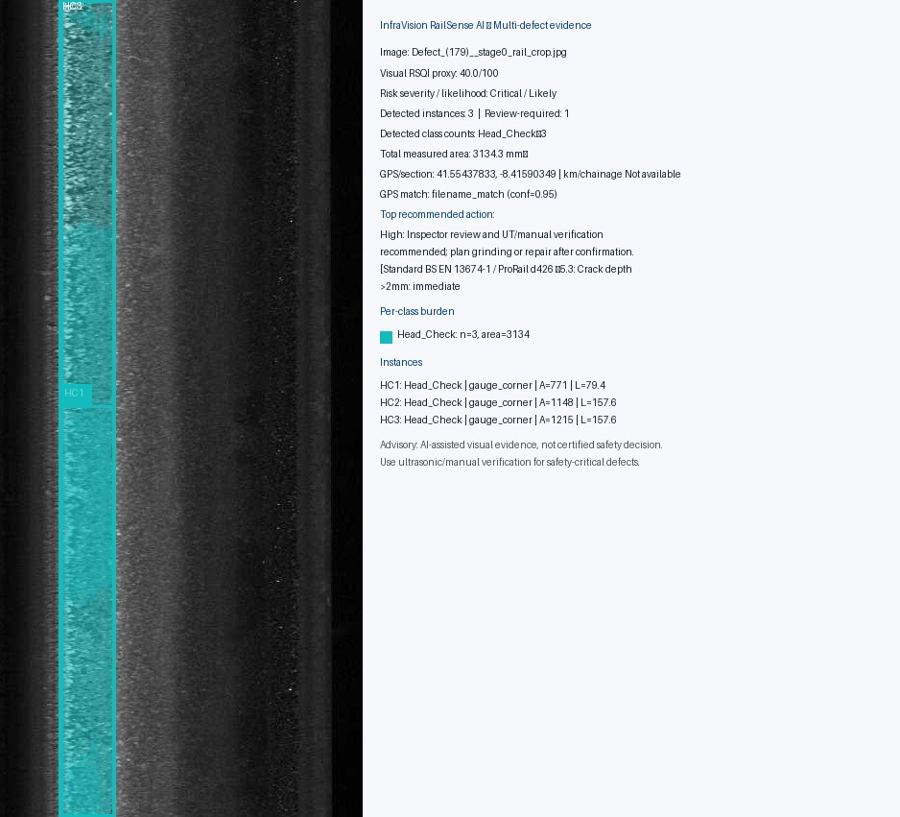
A structured finding can retain evidence from multiple stages rather than only the final prediction.
These views show how the current defect mix can be translated into traffic- and time-based planning scenarios. They are deliberately labelled as hypotheses for operator validation, not as operational forecasts.
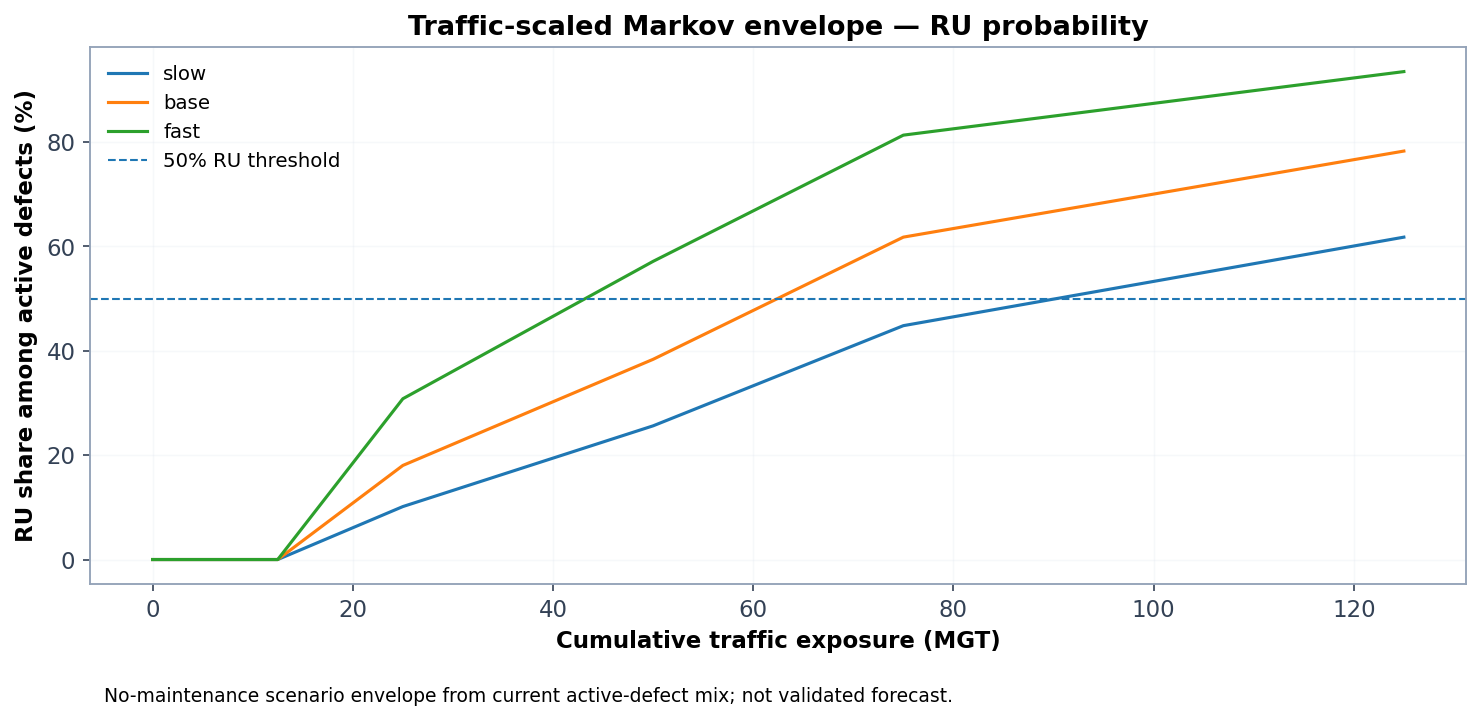
Explores the share of active defects reaching the RU state under slow, base and fast exposure assumptions. The transition model requires repeated inspections of the same assets before it can be treated as a validated forecast.
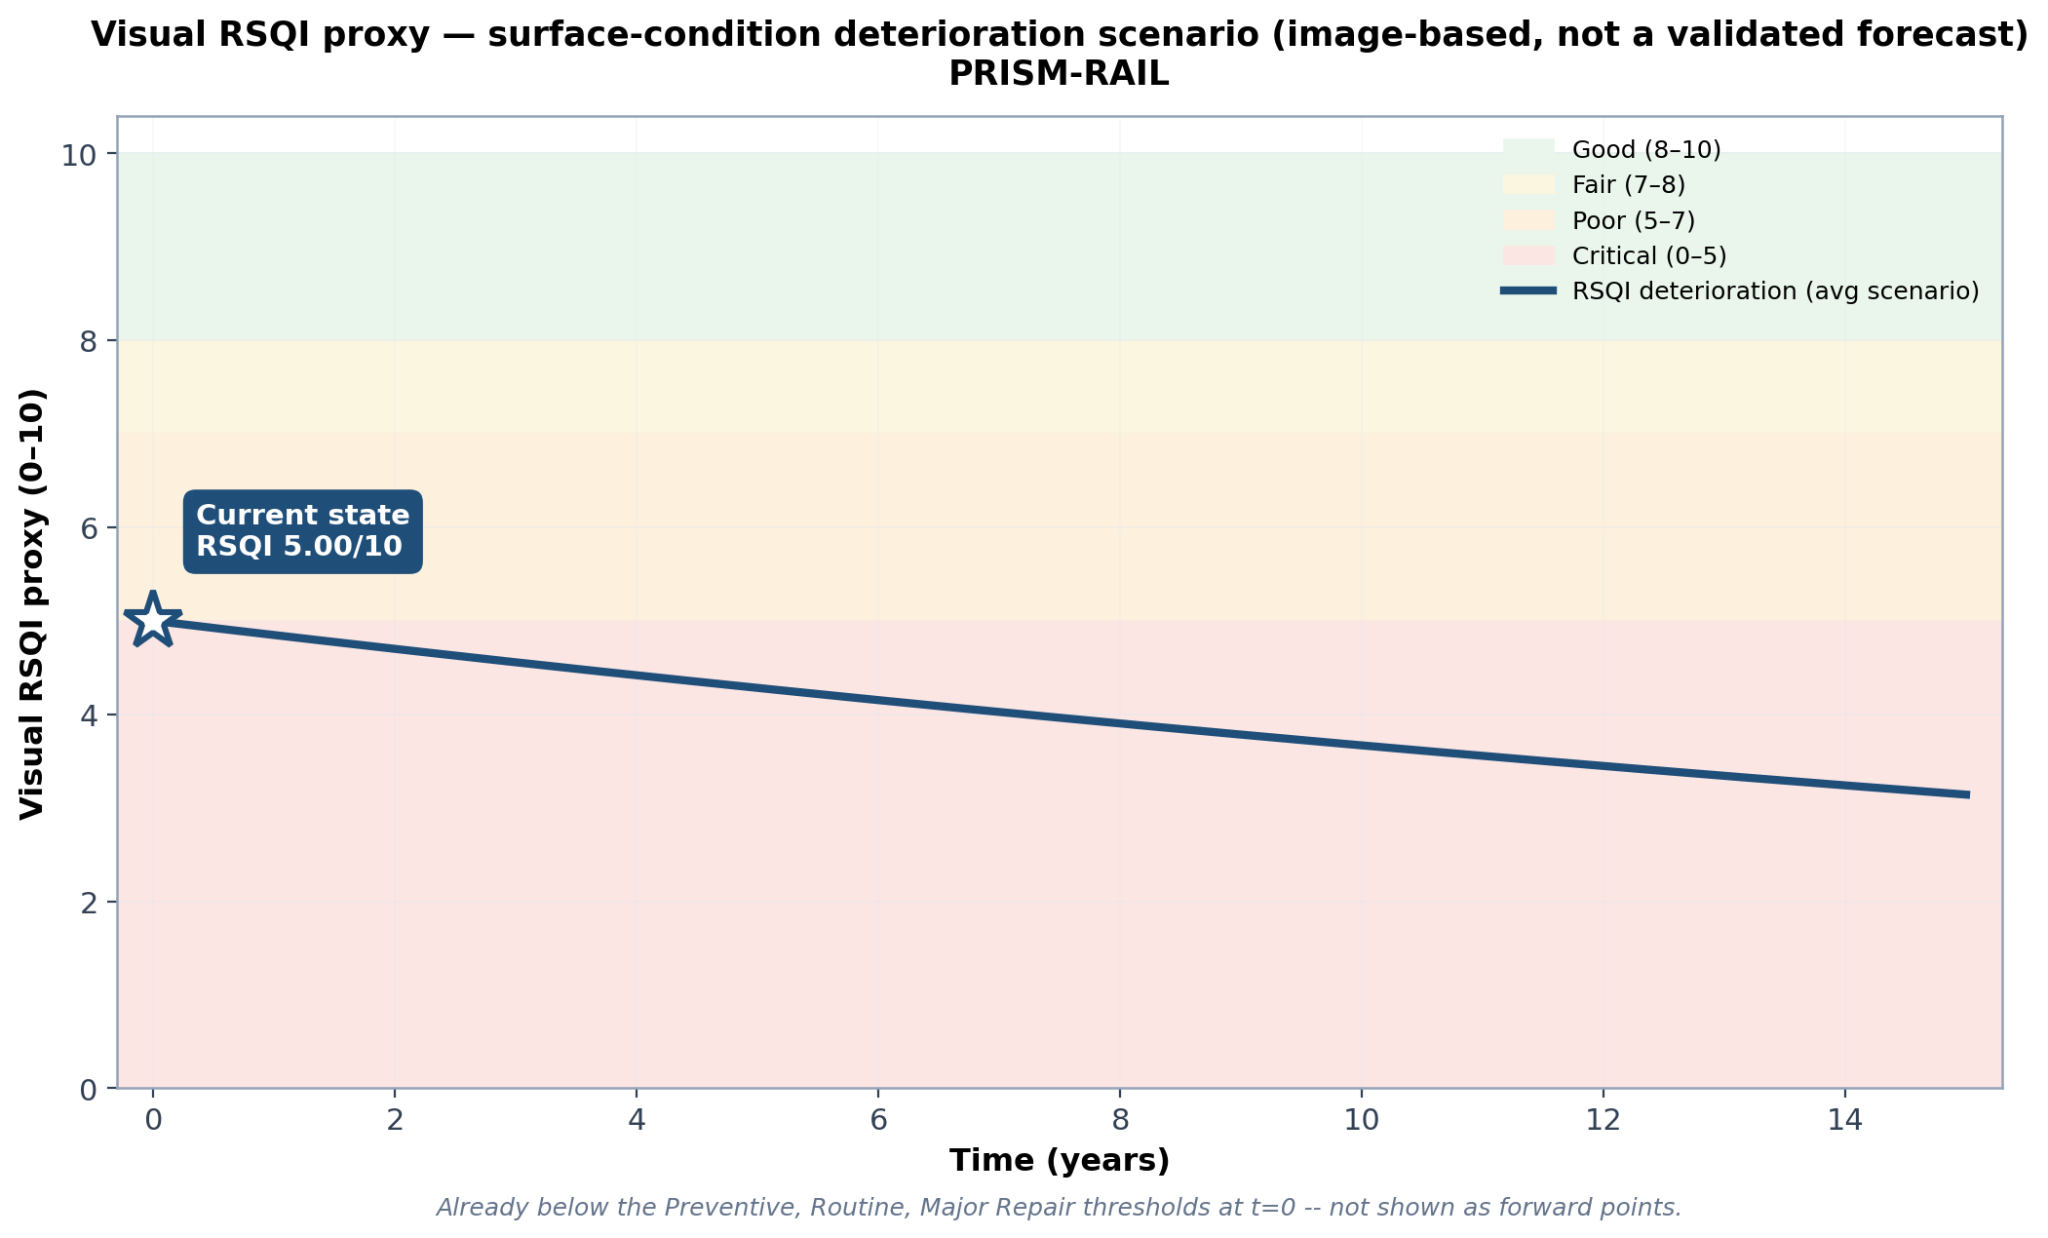
Shows an image-based surface-condition trajectory over time. It is a decision-support research view; local calibration, repeated inspections and operator maintenance records are required for production use.
This prototype is designed as an AI-assisted inspection and evidence-triage layer. It is not certified for autonomous maintenance decisions.
The same product narrative works whether an organisation already collects rail-head imagery or needs a small image-acquisition pilot to evaluate the visual layer.
Run RailSense on existing inspection imagery without replacing geometry, ultrasonic or other condition-monitoring systems.
Scope a short acquisition campaign, then evaluate the same quantitative evidence chain on a known section.
The next step is a bounded technical validation exercise with shared evidence, expert reference labels where available, and pre-agreed evaluation criteria.